Insight through conversation
Making data analysis accessible to all
Retail demo data - Foodmart Overview
The data is based on a company that sells products through a number of stores. So, you can ask questions about stores, products, customers and a number of values such as sales and costs. See below for more detail...
Reportable values
It has store sales, store costs and profits as values that can be reported on. The unit sales are also recorded along with a sales count.
Below are some example questions:
"How much revenue was made last year ?"
"Add Store costs and Profit"
"Which store state had the highest costs this month?"
Locations
The company sells in 3 countries (USA, Canada & Mexico); within each country you have states and citys and then one or more stores.
"Which country made the most profit ?"
The stores
The stores are named 'Store' and a number eg 'Store 1'. The stores themselves have useful information such as who mananges it, its overall size and type.
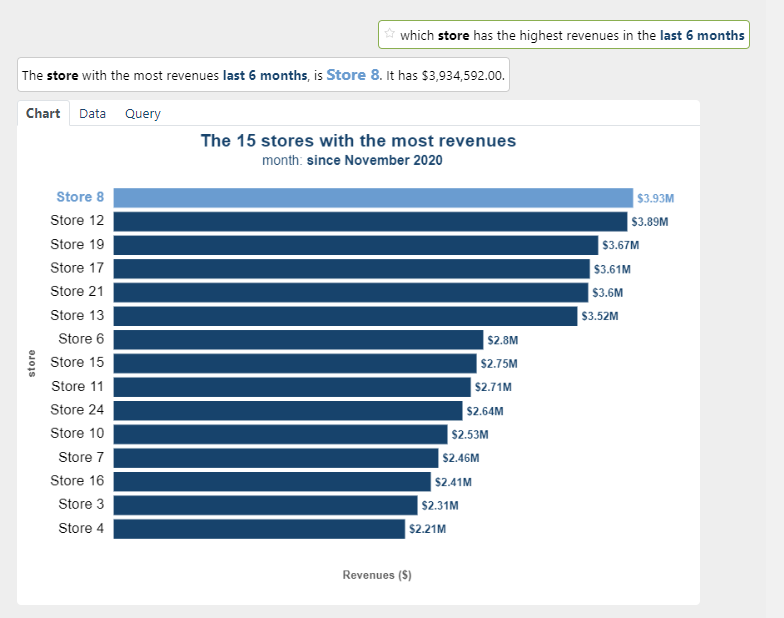
Which store has the highest revenues in the last 6 months ?
Which type of store was most profitable for the last 6 months
"Which store state had the highest costs this month?"
"Is that a large store?"
The products
The products that the stores sell are grouped into a family (such as Drink, Food etc), then these are broken down into departments, categories, subcategories, brand names then the product itself.
The table shows an example:
| Level | Example | |
|---|---|---|
| Family | Drink | |
| Department | Alcoholic Beverages | |
| Category | Beer & Wine | |
| Subcategory | Beer | |
| Brand name | Portsmouth | |
| Product Name | Portsmouth Light Beer | |
Example questions:
What was our best selling product category last year?
Where did we sell most of those?
The customers
The customers who buy the products from the stores are also associated with a country, state & city. Their gender, marital status are recorded along with their annual income and age.
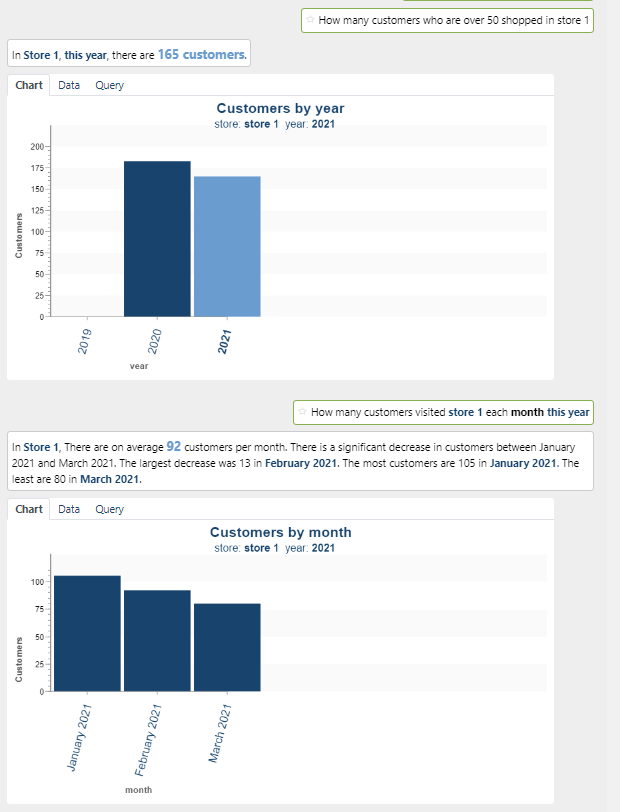
How many customers who are over 50 shopped in store 1?
How many customers visited store 1 each month this year?
Date/Time
Date/Time in this dataset relates to when a sale was made and you can ask questions at the following levels - Year, Quarter, Month, Week and Day
You can also use relative dates such as this, last, today etc.
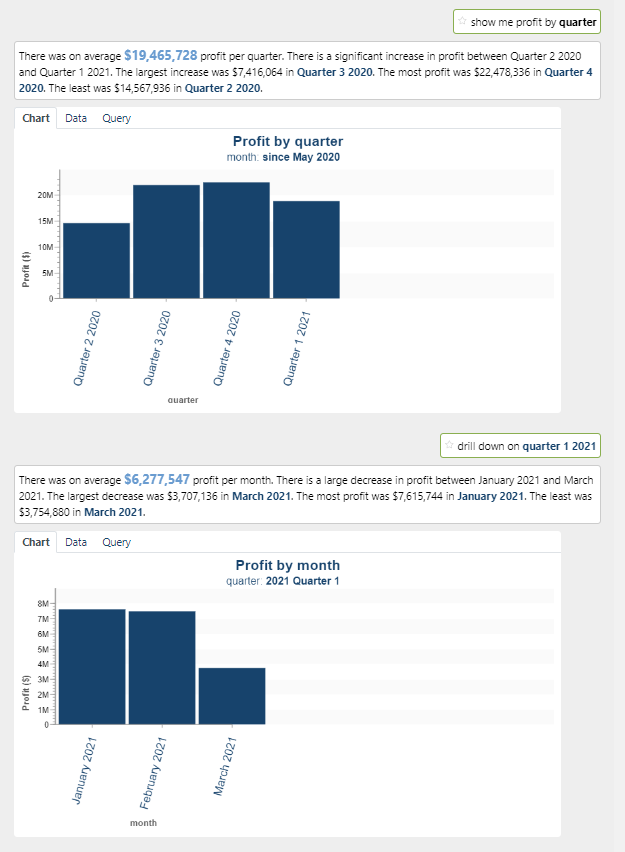
Show me profit by quarter
Drill down on quarter 1 2021
How many sales did we make last week?